
Beyond Active Share
A within-mandate manager-efficiency framework using ERM3 residual decomposition
Conrad Gann · Blue Water Macro · Working Paper · June 2026 (Q1 2026 N-PORT refresh)
Abstract
Active Share helped allocators ask an important question: is this manager truly active, or mostly hugging a benchmark? But for manager selection, that is only the first step. Once an allocator has chosen a mandate — large blend, large growth, value, international, or any other style box — the more important question is different: which managers have historically turned their active decisions into persistent stock-specific contribution, rather than simply riding a style or thematic tilt?
This paper introduces a returns-based framework for answering that question using the ERM3 cascade. ERM3 decomposes each fund's daily gross return into market, sector, subsector, and residual layers. The residual layer is the part left after broad systematic exposures have been stripped away. It is not a pure measure of skill — fees, implementation, and trading frictions still matter — but it is the cleanest layer for studying whether a manager's stock selection has added value beyond the exposures an allocator may already have chosen.
Using 997 active U.S. mutual funds and 19 years of monthly observations, we find that managers with stronger trailing residual performance tend to produce stronger future residual performance. The result is not driven by past gross returns, which have little predictive power for future residual return in this sample. Nor is it only a disguised value, growth, or momentum bet. The signal survives the harder test: comparing managers inside similar mandates, where broad style exposure is less likely to explain the result. It is strongest among value-like managers, where broad style premium is least likely to be the driver.
The practical implication is simple. Allocators should choose the mandate first, then evaluate managers inside that mandate by the efficiency of their residual contribution. Active Share can tell whether a fund is different from its benchmark. ERM3 shows what kind of difference it is — benchmark drift, style exposure, thematic concentration, or stock-specific contribution — and, most importantly, identifies residual features that generalize into the next 12 months of fund outcomes.
Key findings
- The ERM3 residual layer separates stock-specific fund contribution from market, sector, and subsector exposure.
- Sorting funds by trailing residual Sharpe produces a positive forward 12-month residual-return spread of +1.77 percentage points between the highest and lowest ranked groups.
- Sorting by trailing gross return does not produce a statistically reliable forward residual-return signal.
- The signal survives the harder test: comparing managers inside similar mandates, where broad style exposure is less likely to explain the result.
- It is strongest among value-like managers, where broad style premium is least likely to be the driver: +2.25 percentage points between highest- and lowest-ranked groups in forward residual return.
Outline. §1 The within-mandate question allocators actually ask (relation to performance literature) · §2 The ERM3 cascade and the residual layer · §3 The Manager Map: diagnostic archetype positioning · §4 Forward validation: residual efficiency persists inside mandates · §5 Caveats and limitations · §6 Product roadmap · Appendix A (methodological detail; A.8 API summary).
1. The within-mandate question allocators actually ask
Active management is usually evaluated in the wrong order. A fund is compared to a benchmark, its Active Share is reported, and the manager is labeled more or less active. That is useful, but it does not answer the question most allocators face when capital is actually being assigned.
By the time an allocator is choosing a manager, the broad mandate has usually already been chosen. The allocator wants large blend, large growth, value, small cap, international, or some other defined exposure. Inside that mandate, the real question is not simply whether a fund is different from its benchmark. The question is whether the manager's active decisions have produced persistent stock-specific contribution after the major sources of systematic exposure have been separated out.
That distinction matters. A fund can look active because it owns a heavy sector or theme tilt. Another can look active because it holds a concentrated set of individual names that have contributed beyond the fund's market, sector, and subsector exposures. Those are very different underwriting stories. The first may be a style decision the allocator could make elsewhere. The second is closer to the manager-selection problem allocators actually care about.
Active Share, in its classic form, is holdings-based. It measures how different a portfolio is from a benchmark at a point in time. It does not tell the allocator whether that difference came from broad exposure, style drift, thematic concentration, or stock-specific manager contribution.
ERM3 approaches the problem from returns instead of weights. It decomposes each fund's realized return into market, sector, subsector, and residual layers. That allows us to ask a more precise question:
- How much of the fund's return came from systematic exposure?
- How much came from style or thematic positioning?
- How much remained as stock-specific residual contribution?
This paper uses that residual layer to study manager efficiency across historical mutual-fund portfolios. The test is deliberately practical: does a manager's past residual efficiency contain information about future residual outcomes, once funds are compared inside the style mandate an allocator has already chosen?
Relation to mutual-fund performance research
The mutual-fund performance literature has spent decades showing why manager skill is hard to measure. Broad fund returns mix too many things together: market exposure, style exposure, sector bets, expenses, cash, flows, implementation, and luck. Carhart (1997) showed that much apparent persistence is explained by common factors and costs. Berk and Green (2004) explained why even real skill may be competed away as assets flow to successful managers. Cremers and Petajisto (2009) improved the practical toolkit with Active Share, asking whether a manager is meaningfully different from a benchmark. Fama and French (2010) emphasized how difficult it is to separate skill from chance across the full mutual-fund universe.
But difference alone is not enough. Active Share can tell an allocator that a fund is active. It cannot tell whether that activity came from a deliberate style tilt, a thematic bet, or stock-specific selection. That distinction is exactly where allocator underwriting happens.
ERM3 gives the problem a sharper instrument. Instead of treating fund performance as one blended return stream, it decomposes each fund into market, sector, subsector, and residual layers. That makes it possible to study the part of return most directly tied to stock-specific manager contribution, while separately accounting for the systematic exposures an allocator may already want.
The result is a more precise version of the old active-management question. We are not asking whether active funds beat passive funds in the abstract. We are asking whether, inside a mandate the allocator has already chosen, residual manager efficiency contains forward information. Across 997 active U.S. mutual funds and 19 years of observations, the answer is yes: managers with stronger residual efficiency tend to produce stronger future residual outcomes, especially when compared against peers with similar style exposure.
2. The ERM3 cascade and the residual layer
The framework is built directly on the ERM3 multi-layer cascade decomposition from RiskModels API. For any fund at any evaluation date, ERM3 orthogonalizes the fund's daily gross return into four layers:
- L1 — market. Exposure to the broad-market portfolio (S&P 500 or an equivalent for non-US mandates).
- L2 — sector. Net sector exposure after L1 is removed.
- L3 — subsector. Subsector positioning after L1 and L2 are removed.
- Residual. What remains after L1, L2, L3 have been stripped — the portion of the fund's return associated with stock-specific manager judgment.
This residual is what the allocator's question requires. It is the return
component observed within the constraints of the systematic exposures the
manager ran, and the component that should be evaluated on stock-selection
grounds. (It is not identical to skill: implementation drag, fees, and
execution variance also land in the residual layer.) We aggregate the daily
cascade to monthly returns via log-compounding, masking pre-existence and
ghost months using the daily weight_coverage field that records the
fraction of fund AUM mapped to ERM3 on each trading day.
From that decomposition we construct two trailing-window features per (fund, month-end) anchor:
Benchmark independence (x-axis): one minus the trailing 36-month R² of fund gross return on the declared benchmark ETF (SPY mapped to IVV; Russell-1000 family mapped to IWB / IWF / IWD; mid- and small-cap likewise). High independence means a fund's returns are explained by something other than its declared benchmark.
Residual Sharpe (y-axis): trailing 36-month Sharpe ratio of the residual return series — a proxy for residual manager efficiency. Funds that consistently generate positive residual return with low volatility score higher.
These two axes are not independent of each other in principle, but in practice they capture orthogonal information. A fund can be highly independent of its benchmark (heavy thematic tilt) without high residual Sharpe (the tilt itself drives variance, with little stock-specific edge). Conversely, a benchmark-aware fund can have high residual Sharpe — picking winners within a narrow style mandate.
A median split on each axis yields four allocator-language quadrants:
| Quadrant | Independence | Residual Sharpe |
|---|---|---|
| Focused stock selector | High | High |
| Benchmark-aware picker | Low | High |
| Style/thematic bet | High | Low |
| Closet index | Low | Low |
3. The Manager Map: diagnostic archetype positioning
The Manager Map is an interpretability and product layer. It positions funds on benchmark independence and trailing residual Sharpe so allocators can read manager behavior in familiar language. It is not the paper's predictive proof — that test is in Section 4.
We apply the framework to the top-1000 actively managed U.S. mutual funds by
2026 AUM, restricted to fund-months where ERM3 cascade coverage is at least 85%
of fund AUM (mean_weight_coverage_36m >= 0.85). The sample contains 170,710
fund-month observations across 997 funds spanning 2007 to May 2026 (Q1 2026 N-PORT BIT processed 2026-06-02).
Within that universe, we focus on the large-blend cohort as the body sample: funds whose declared benchmark in their most recent N-1A filing maps to SPY/IVV or equivalent large-blend U.S. exposure (N=336 at the 2025-12-31 anchor with complete independence and residual-Sharpe data; six additional large-blend funds appear in the quadrant table when median splits assign quadrants but lack one of those two features). It is the largest cell, the benchmark methodology is most mature for U.S. large-cap, and the flagships allocators recognize sit primarily in this group.
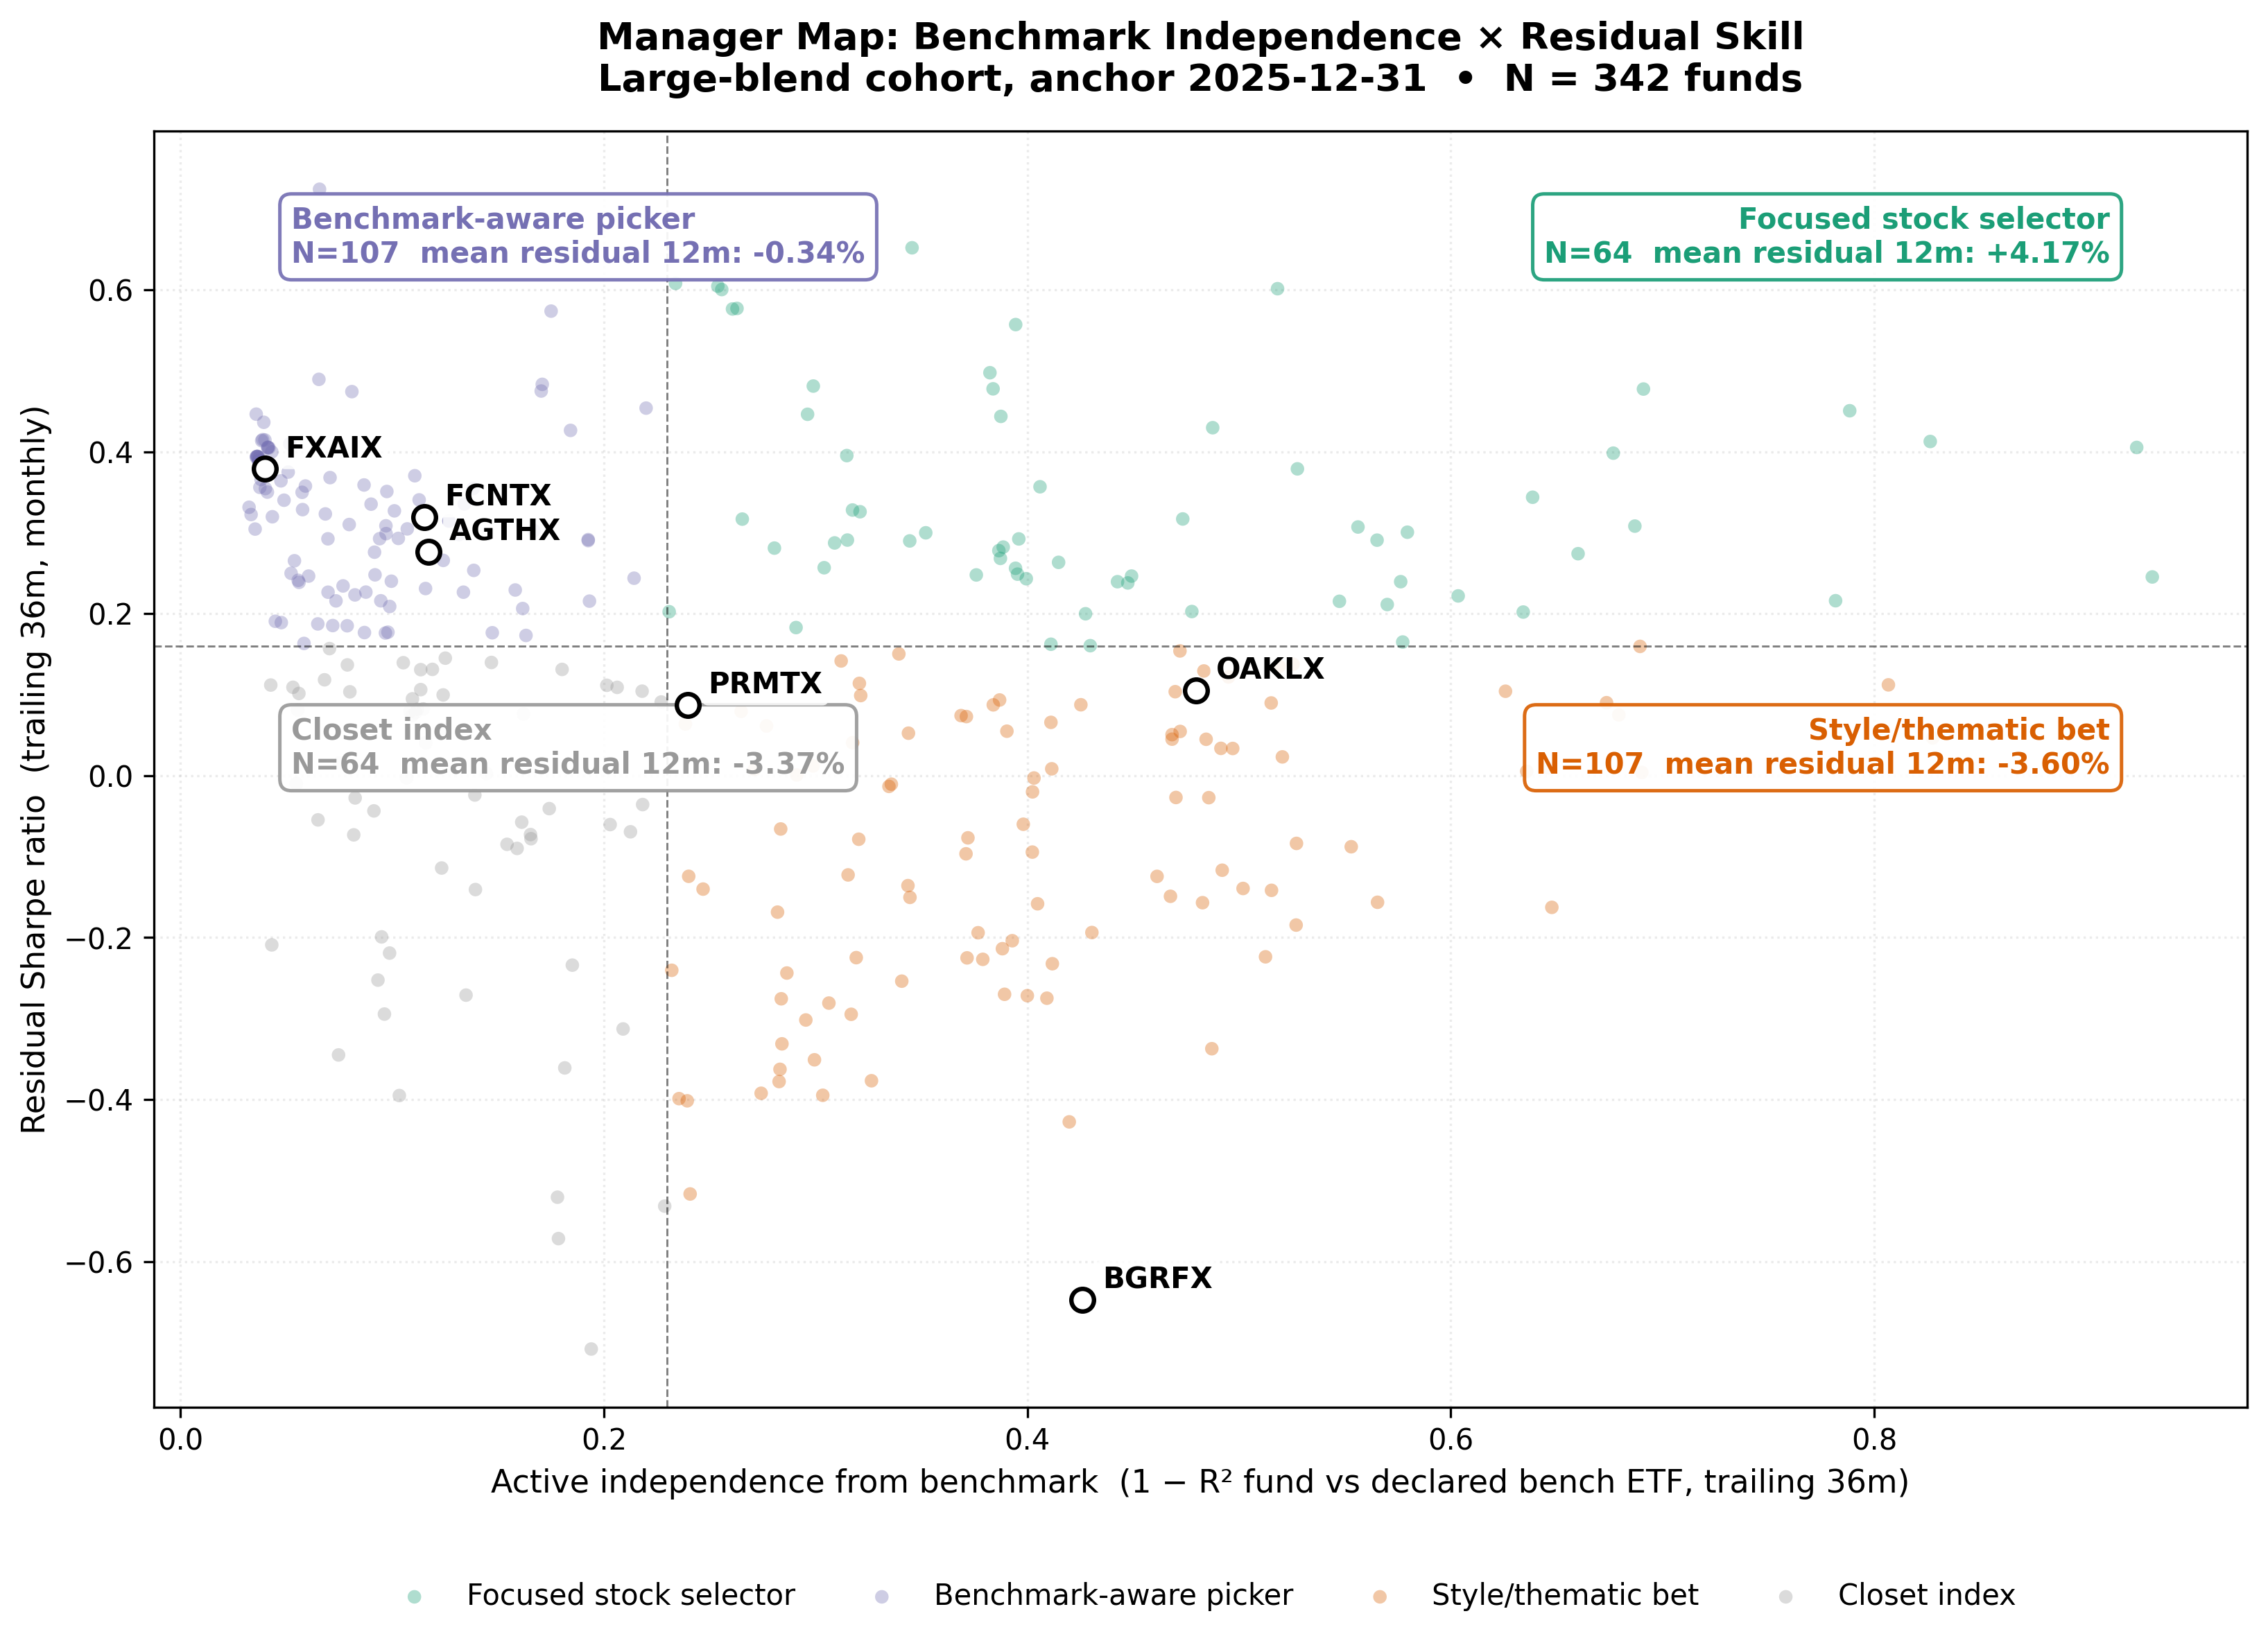
Figure 1 — Manager Map (diagnostic). Each point is one large-blend fund at the 2025-12-31 anchor. X-axis: trailing 36-month active independence from benchmark (1 − R² of fund gross return on declared bench ETF). Y-axis: trailing 36-month residual Sharpe. Median splits define quadrants. Five active funds are labeled (FCNTX, AGTHX, FLCSX, BGRFX, FMAGX) as quadrant exemplars. Quadrant annotations show fund count and mean trailing 36-month residual return within each archetype (diagnostic outcome at the anchor; not forward validation).
Figure 1 is a diagnostic map, not the predictive test. It shows whether the ERM3 axes organize already-realized residual outcomes in an allocator-intuitive way. Section 4 asks the harder question: whether the same residual-efficiency feature predicts forward residual return.
Quadrants use median splits on trailing 36-month benchmark independence (x-axis) and residual Sharpe (y-axis). The table reports mean trailing 36-month residual return within each archetype — compounded stock-specific outcome over the same horizon as the map features.
| Archetype | N | Mean trailing 36m residual return |
|---|---|---|
| Focused stock selector | 59 | +14.43% |
| Benchmark-aware picker | 109 | +10.36% |
| Style/thematic bet | 109 | −5.43% |
| Closet index | 59 | −2.03% |
| Corner spread (Focused − Closet) | +16.46pp |
Reading the map: four familiar examples
The Manager Map is not a ranking table; it is a way to separate different kinds of active management. Figure 1 labels five active mutual funds at the 2025-12-31 anchor (index funds and sector ETFs are excluded from this illustration).
FCNTX and AGTHX sit in the benchmark-aware picker region: their returns remain meaningfully tied to a broad large-cap benchmark (active independence ≈ 0.12), but their trailing residual Sharpe is well above the cohort median (≈ 0.32 and 0.28). In allocator language, these are not “go anywhere” thematic bets. They are closer to managers trying to add stock-specific value while staying inside a recognizable large-cap mandate.
FLCSX (Fidelity Large Cap Stock) sits in the focused stock selector region: higher benchmark independence (≈ 0.26) and higher residual Sharpe (≈ 0.58). This is the archetype Active Share tries to find, but ERM3 makes the distinction sharper by separating benchmark difference from residual contribution.
BGRFX (Baron Growth) illustrates the style/thematic-bet quadrant: high benchmark independence (≈ 0.43) but weak trailing residual Sharpe (≈ −0.65). A fund can be very different from its benchmark without generating attractive stock-specific residual contribution in this window.
FMAGX (Fidelity Magellan) illustrates the closet-index quadrant: low benchmark independence (≈ 0.11) and below-median residual Sharpe (≈ 0.14). Magellan remains a historically prominent active fund in allocator memory, but in this snapshot its returns track the large-cap benchmark closely while residual efficiency sits below peers with stronger stock-specific contribution. The label is a diagnostic placement, not a verdict on the manager’s long-run reputation.
The corner spread orders archetypes as the framework predicts: high independence plus high residual Sharpe sits above low independence plus low residual Sharpe. Style/thematic bets (high independence, low residual Sharpe) trail benchmark-aware pickers in this cohort and period. These are realized diagnostic orderings — useful for placement and peer conversation, not underwriting evidence on their own.
Closet index funds can still show negative trailing residual from fees, implementation drag, or small persistent stock-level deviations; the label means low benchmark independence and below-median residual Sharpe, not perfect index replication.
The x-axis currently uses benchmark-fit R² rather than strict Cremers-Petajisto L3 active share (which requires per-holding subsector attribution against the benchmark). The R² proxy captures the same allocator-relevant question — how much return is benchmark-explained? — and will be replaced by direct L3 and residual active share in production (see §6 and Appendix A.5).
4. Forward validation: residual efficiency persists inside mandates
The validation design is anchored in time. At each fund-month anchor, we use only information available through that date to compute residual-efficiency features. We then observe the fund's residual return over the next 12 months. The test is not whether past gross winners keep winning. It is whether the stock-specific residual layer identified by ERM3 contains information that generalizes forward.
Figure 2 summarizes the design. The same anchor logic is used throughout Section 4. The tests then become progressively stricter: first across the coverage-qualified universe, then across quarter-end anchors, then after removing value/growth exposure from the forward payoff, and finally inside ex-ante mandate buckets.
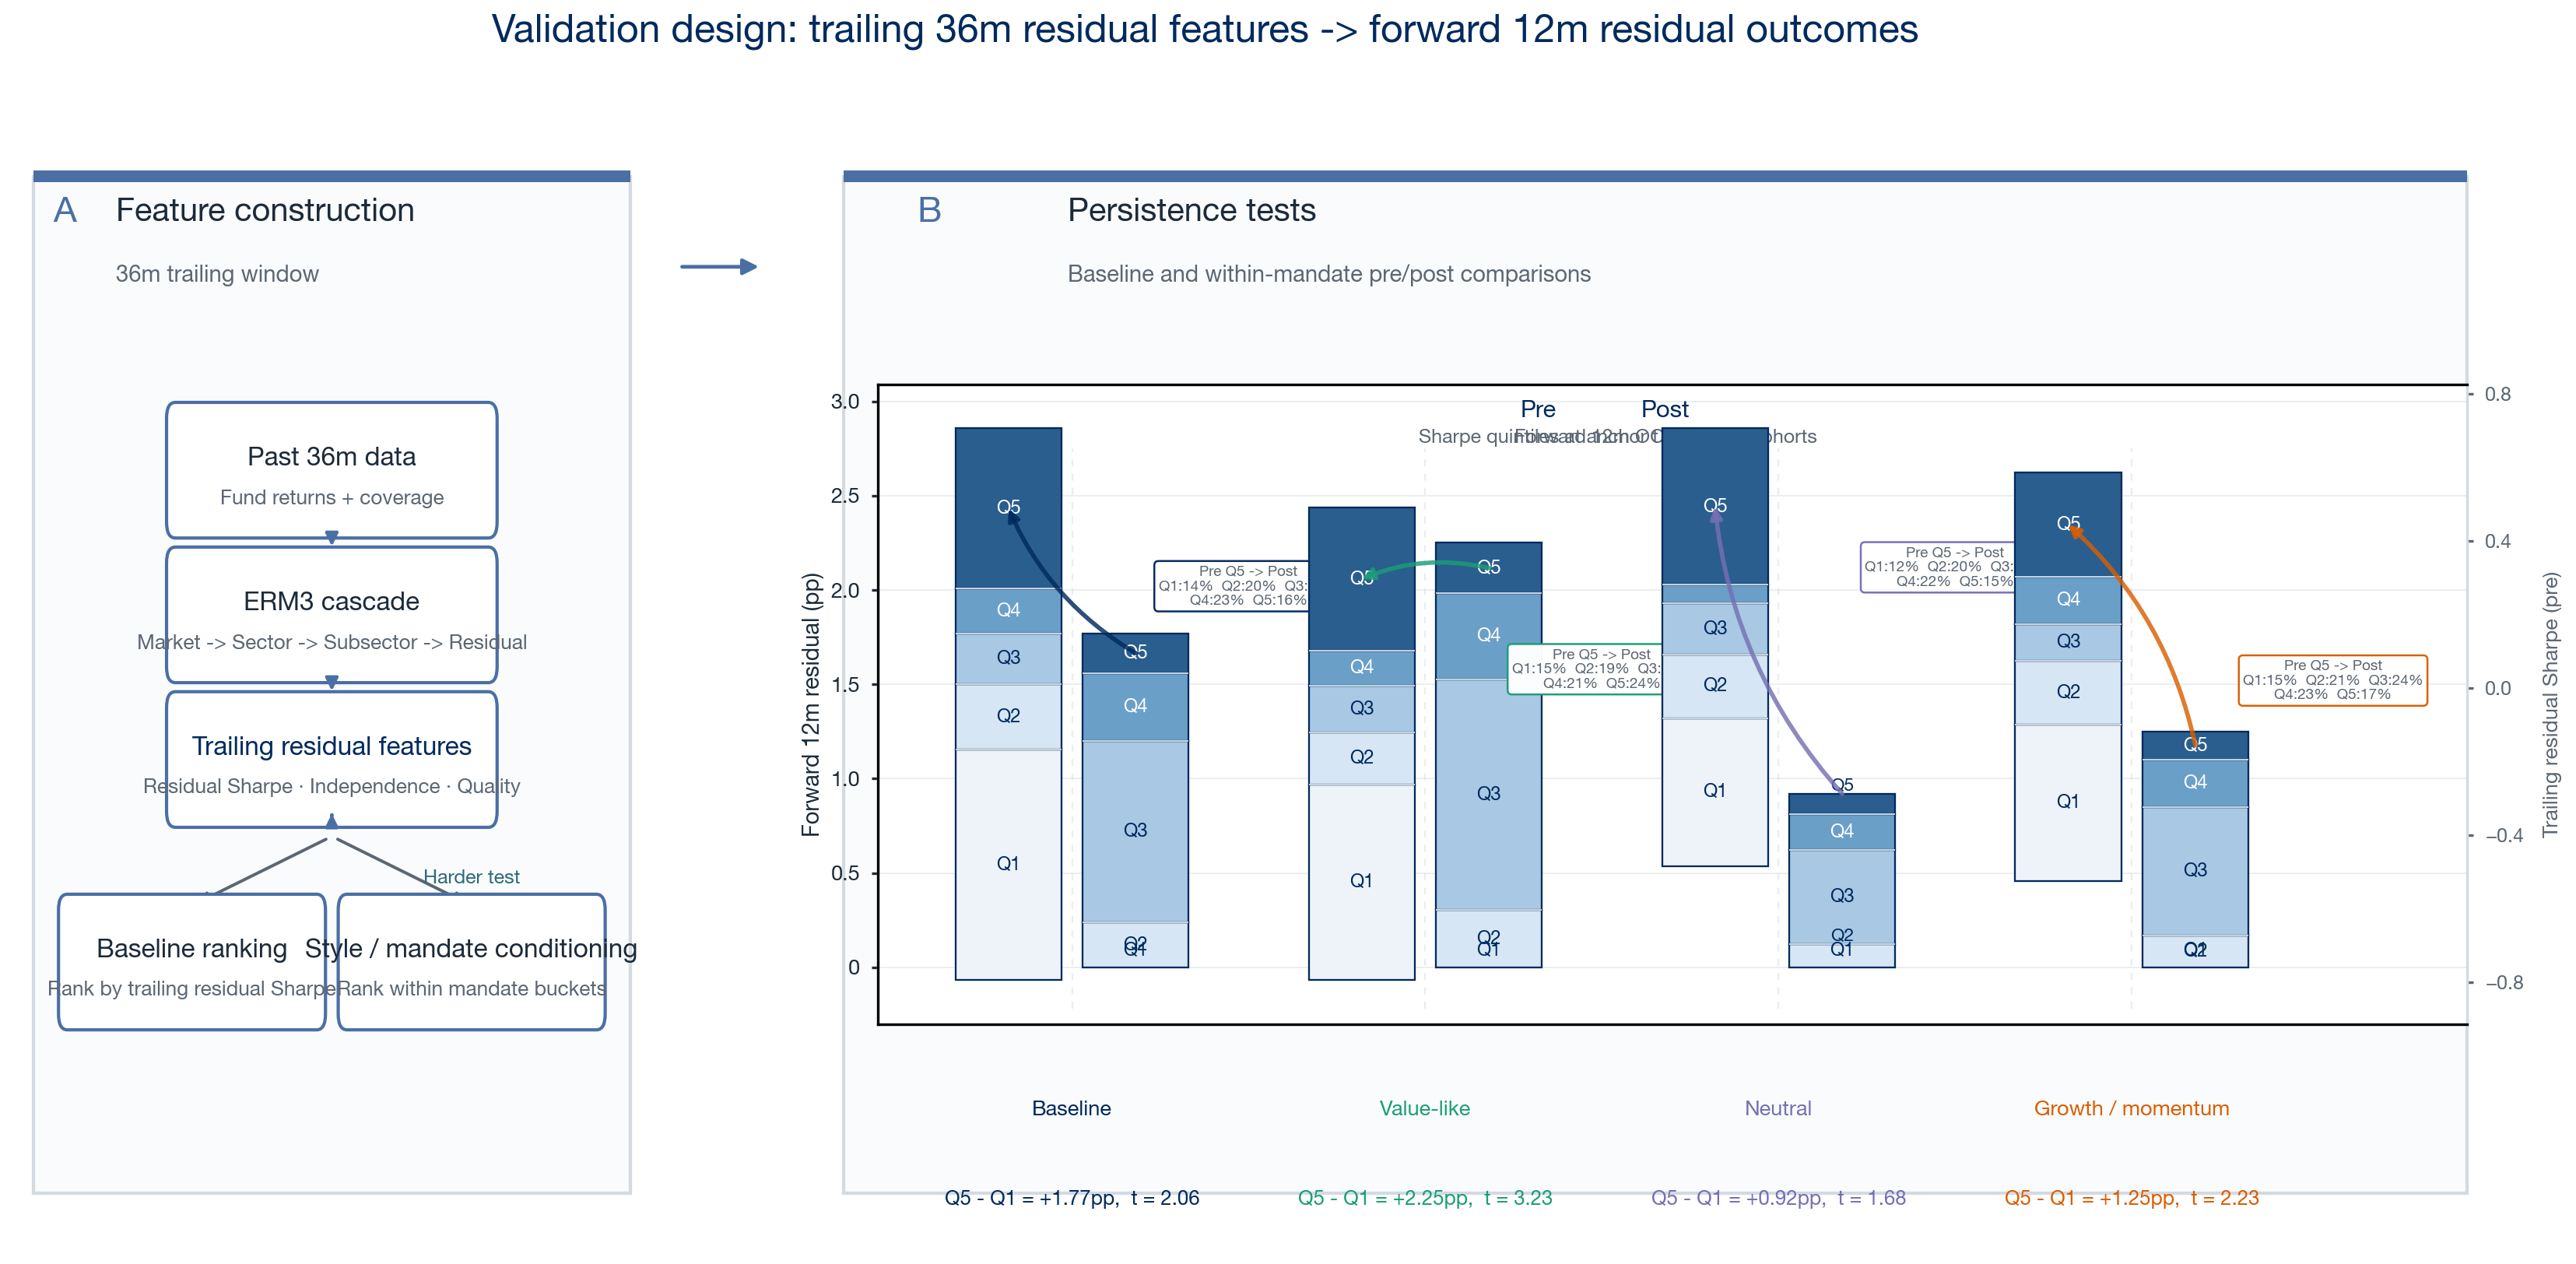
Figure 2 — Validation design. At each anchor date, ERM3 uses only trailing information to decompose fund returns and compute residual-efficiency features. Panel B forms cohorts at t from trailing 36m residual Sharpe (illustrative anchor 2025-12-31): baseline quintile stacks (N=337, ~67 per quintile) and within-mandate stacks inside value-like, neutral, and growth/momentum buckets (~22–23 per quintile). Panel C reports forward 12m OOS outcomes on a shared 0–2.5 pp scale: baseline quintile means (Q5−Q1 = +1.77 pp, t = 2.06) and within-mandate Q5−Q1 spreads (+2.25, +0.92, +1.25 pp with t = 3.23, 1.68, 2.23). Cutoffs are recomputed at each anchor; no look-ahead in rankings.
4.1 Baseline forward sort
For each fund-month anchor t in the coverage-restricted sample, we sort funds into quintiles on a trailing feature (computed using only data through t), and observe each quintile's mean forward 12-month residual return.
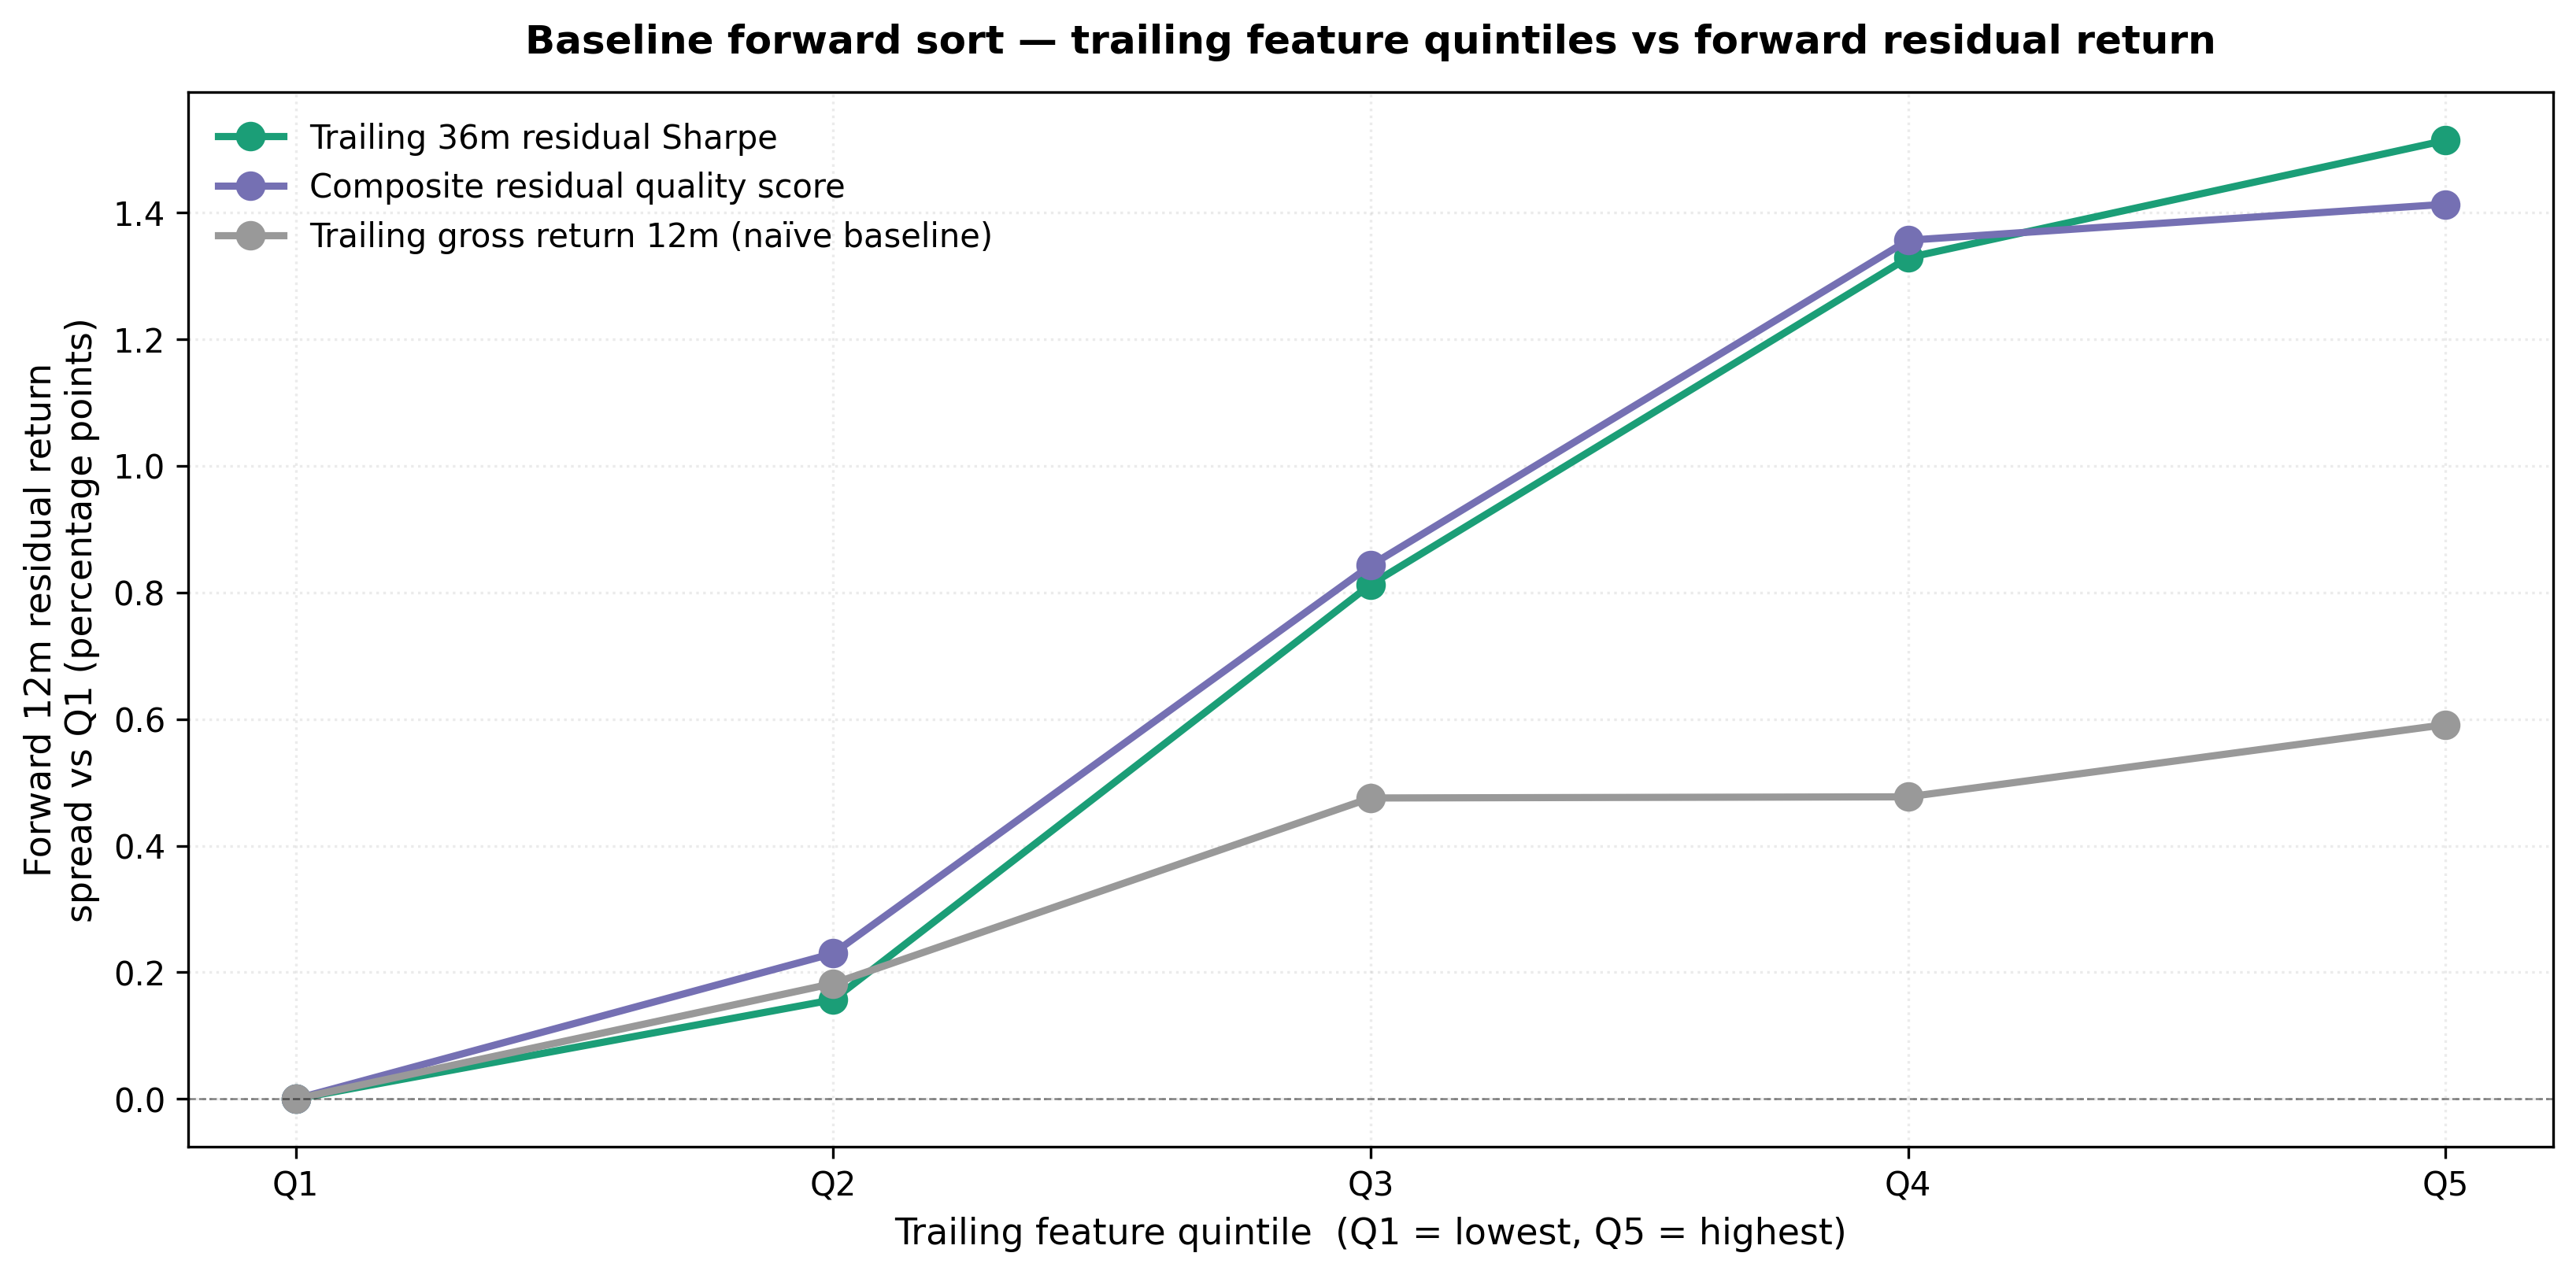
Figure 3 — Baseline forward sort. Before any style conditioning, funds ranked by trailing 36-month residual Sharpe produce monotonic improvement in forward 12-month residual return. Trailing gross return does not produce a statistically reliable residual-return signal. Y-axis: forward residual return spread relative to Q1 for three trailing features: residual Sharpe 36m, composite quality score, and trailing gross return 12m (naïve baseline).
| Sort feature | Q5 − Q1 spread | 95% CI (bootstrap) | t-stat |
|---|---|---|---|
| Trailing residual Sharpe 36m | +1.77pp | [+0.29, +2.96] | 2.06 |
| Composite residual quality score | +1.79pp | [+0.38, +3.03] | 1.92 |
| Trailing gross return 12m (naïve) | +0.70pp | [−0.76, +2.26] | 0.75 |
Sorting on trailing gross return does not predict forward residual return: the naïve baseline confidence interval crosses zero. Sorting on trailing residual Sharpe and the composite quality score does — ERM3 adds information not present in past gross performance. Confidence intervals and cluster-robust t-statistics account for overlapping forward windows and fund-level clustering (see Appendix A.2).
Most of the Q5 − Q1 spread appears by Q3 (Q1–Q5 forward residual means: 0.00 / +0.24 / +1.20 / +1.56 / +1.77 pp). The framework separates above-median from below-median residual efficiency more cleanly than it ranks the top quintile. For allocator use, treat the score as a screening and underwriting signal, not a mechanical top-decile ranking engine.
4.2 Quarterly stability and style-stripped payoff check
The pooled spread averages 199 monthly anchors. For quarterly manager underwriting, we compute the per-anchor Q5 − Q1 spread at each quarter-end from 2008-Q4 through 2025-Q1 (66 anchors).
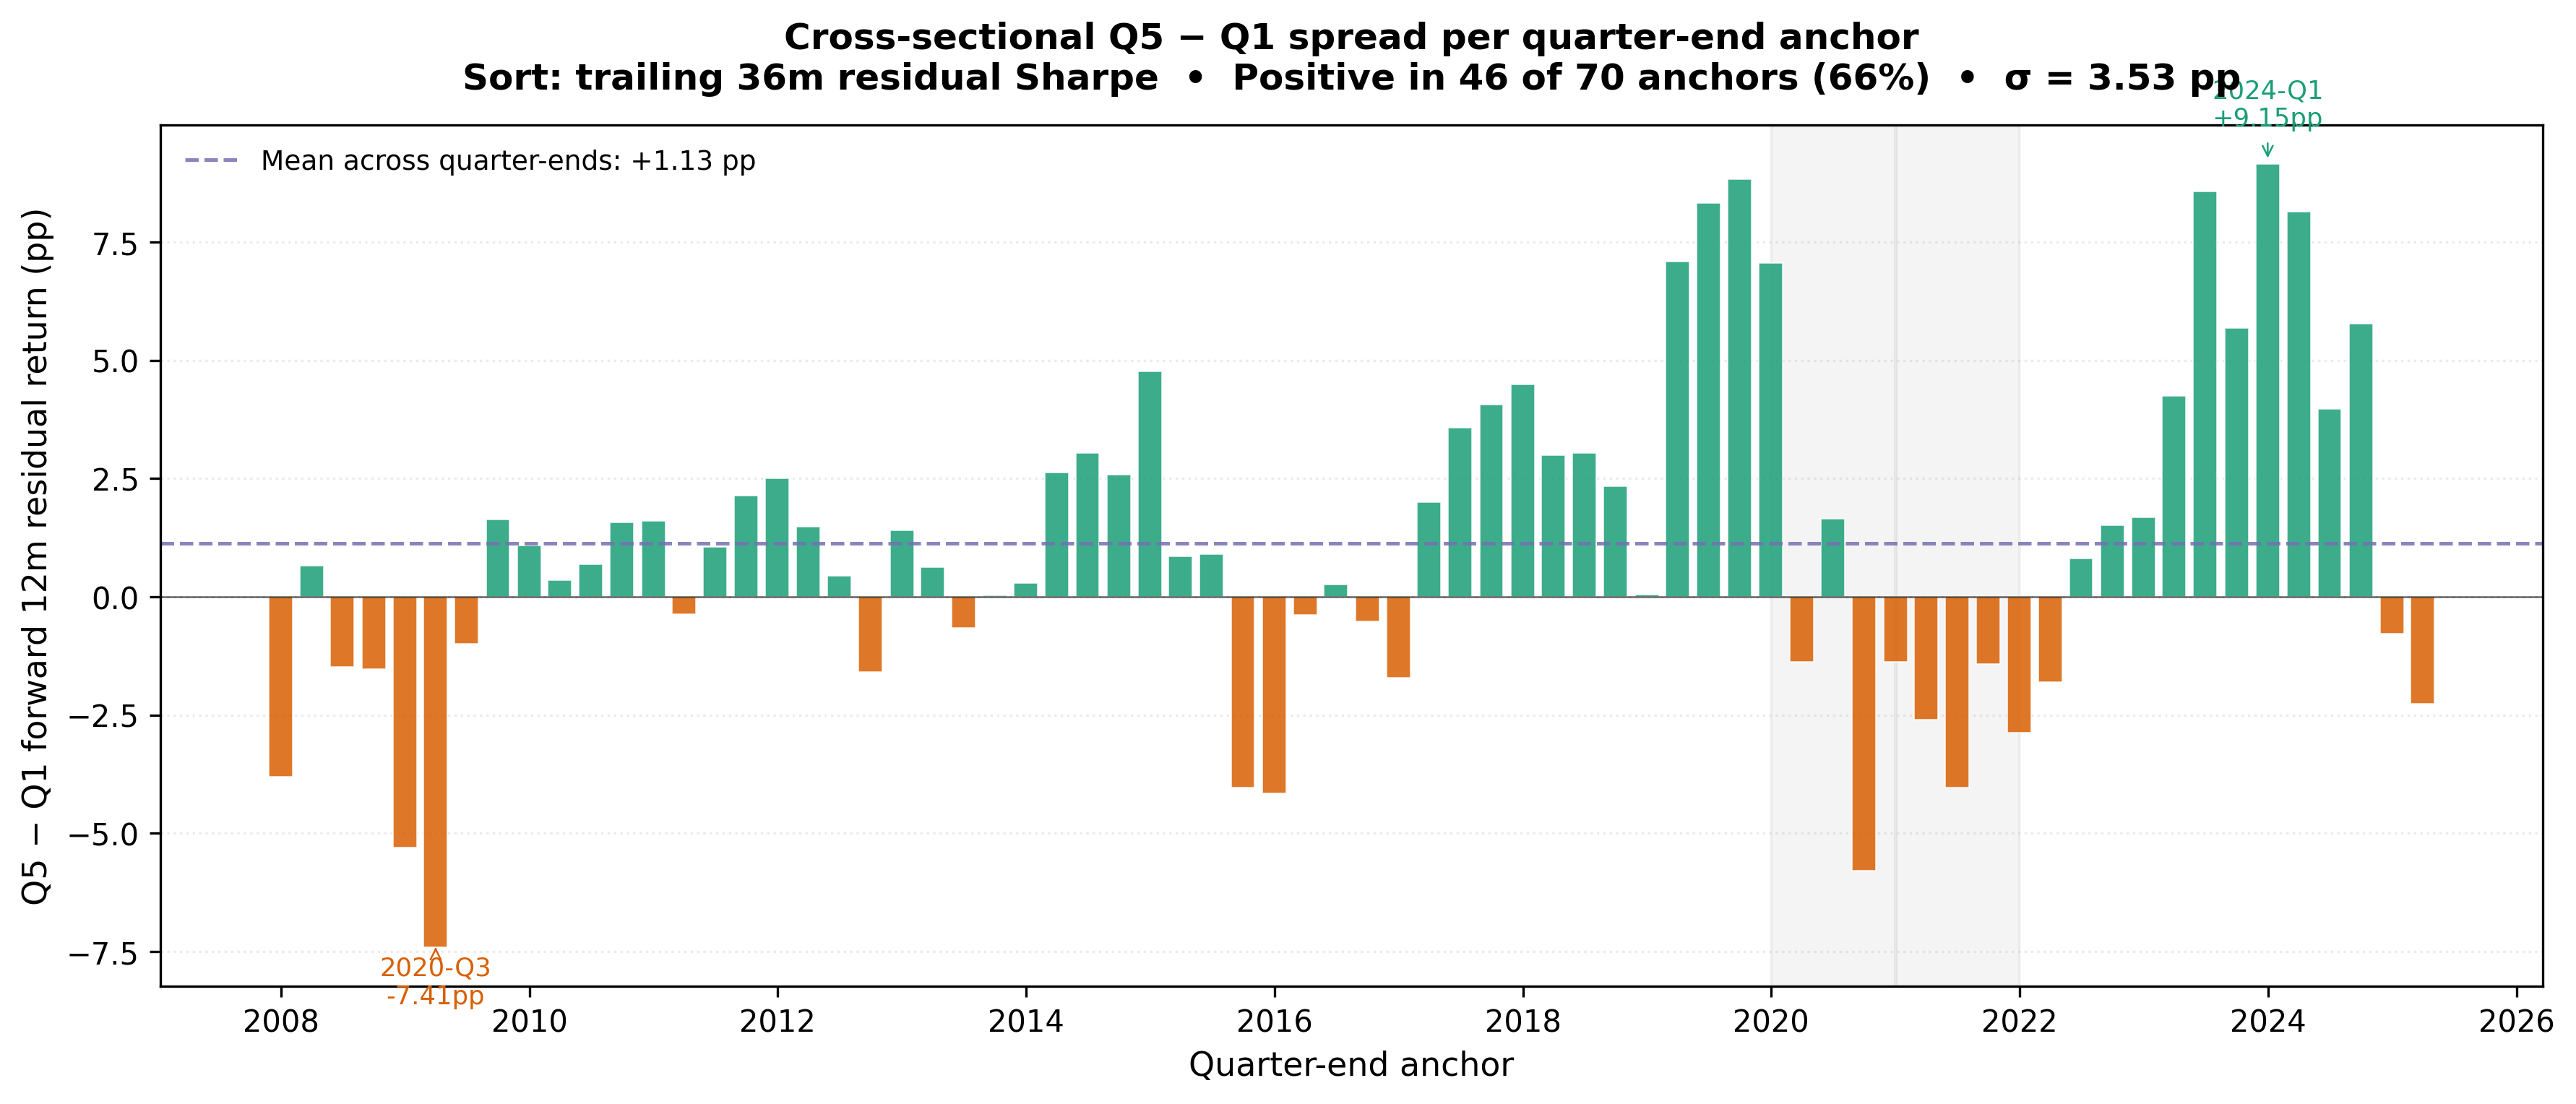
Figure 4 — Quarterly cross-section. Per-anchor Q5 − Q1 forward 12-month residual return spread. Green bars positive, orange negative; dashed line is the mean (+1.48pp). Shaded bands mark weak regimes in 2020 and 2021.
The sort is positive in 47 of 66 anchors (71%), with mean spread +1.48pp and meaningful dispersion (including −6.99pp in 2020-Q3 and +9.97pp in 2024-Q1). COVID (2020) and the momentum-reversal year (2021) account for most negative quarters. Full quarterly metrics are in Appendix A.3.
The signal is persistent enough to support quarterly manager-underwriting use, but not stable enough to be treated as a quarter-by-quarter timing rule.
Part of the unconditional quarterly spread reflects value versus growth/momentum tilt in the Q5 versus Q1 portfolios (Appendix A.4). To isolate stock-specific ranking, we repeat the same quarterly cross-section on the large-blend cohort but strip cross-sectional HML and UMD exposure from the forward 12-month residual at each anchor (regression residuals on ex-ante z(β_HML) and z(β_UMD); sort feature unchanged). This removes value/growth from the payoff without splitting the sample into Fama-style cohort panels.
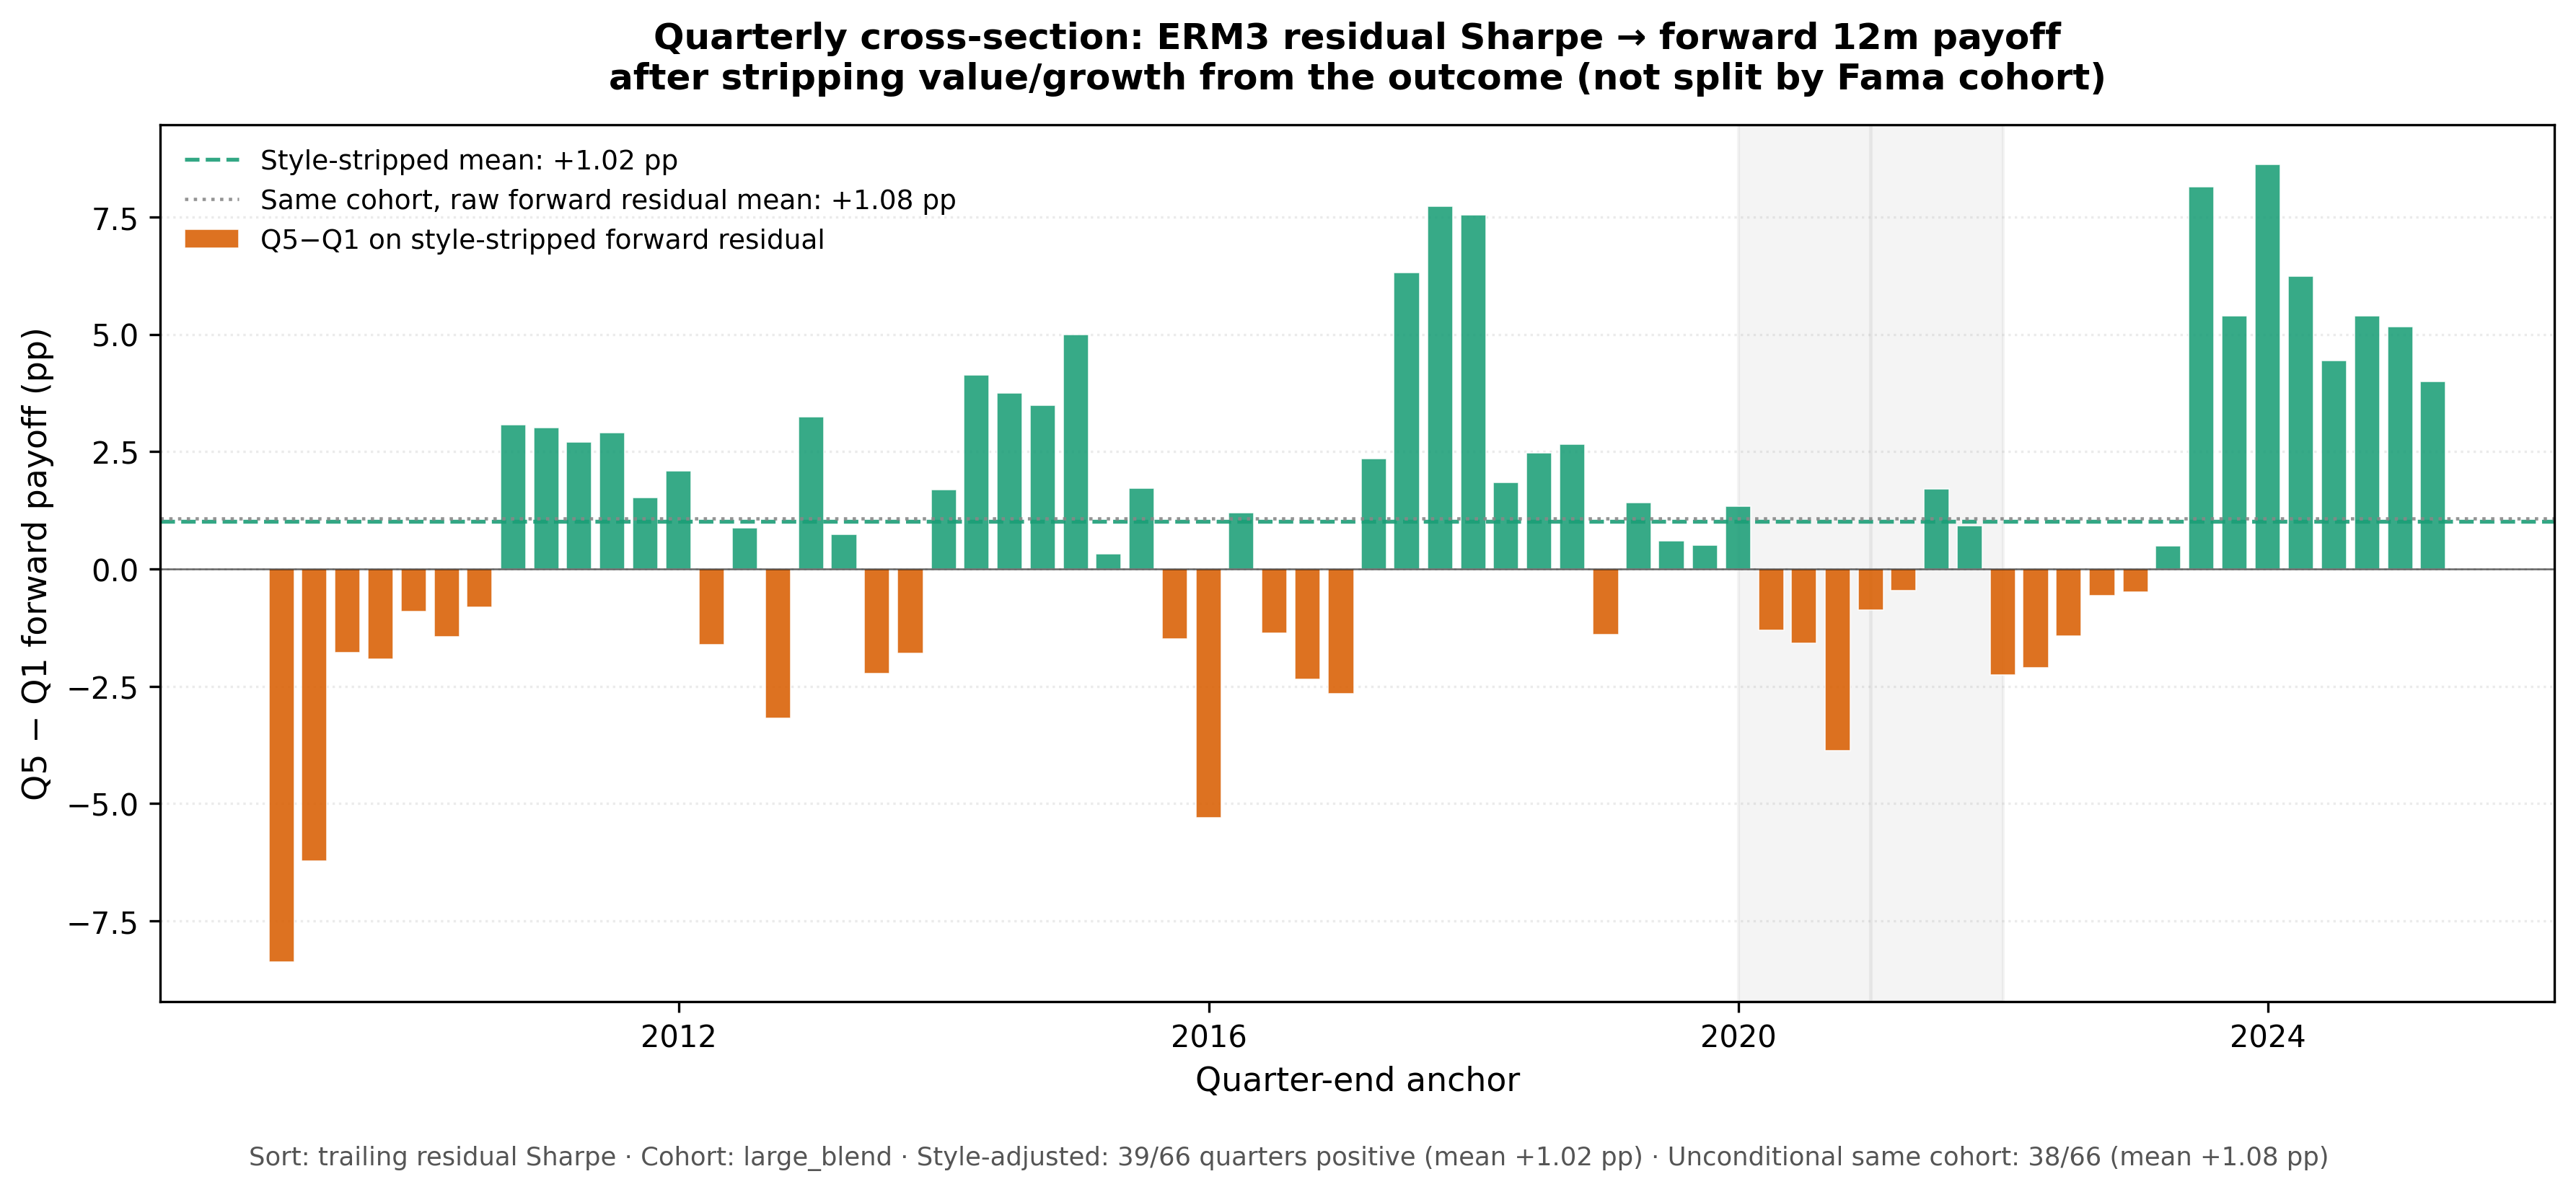
Figure 5 — Quarterly cross-section after style removal from the payoff. Same quintile sort on trailing residual Sharpe; bars are Q5 − Q1 on the style-stripped forward residual. Dashed green: mean +1.35pp (43 of 62 quarter-ends positive). Dotted grey: same cohort with raw forward residual (+1.39pp) for comparison. ERM3 ranking persists after value/growth is taken out of the outcome.
Appendix A.6 notes that trailing residual Sharpe does not predict forward gross return — only forward residual return. The framework sorts on stock-specific residual contribution and that sorting persists into future residual outcomes, not into future systematic exposures.
4.3 Within-mandate validation — the main result
The unconditional +1.77pp spread mixes two economic components:
- Style premium — the Q5 portfolio carries growth and momentum tilt relative to Q1.
- Within-mandate manager efficiency — among funds with similar ex-ante style exposure, ERM3-residual ranking still separates forward outcomes.
Allocators filling a pre-selected mandate care most about the second. We therefore bucket funds by ex-ante style tilt using only data available through each anchor: rolling 36-month β to Mkt-RF / SMB / HML / UMD, then terciles by composite tilt score z(β_UMD) − z(β_HML). Within each bucket we repeat the Q5 − Q1 residual-Sharpe sort on forward 12-month residual return.
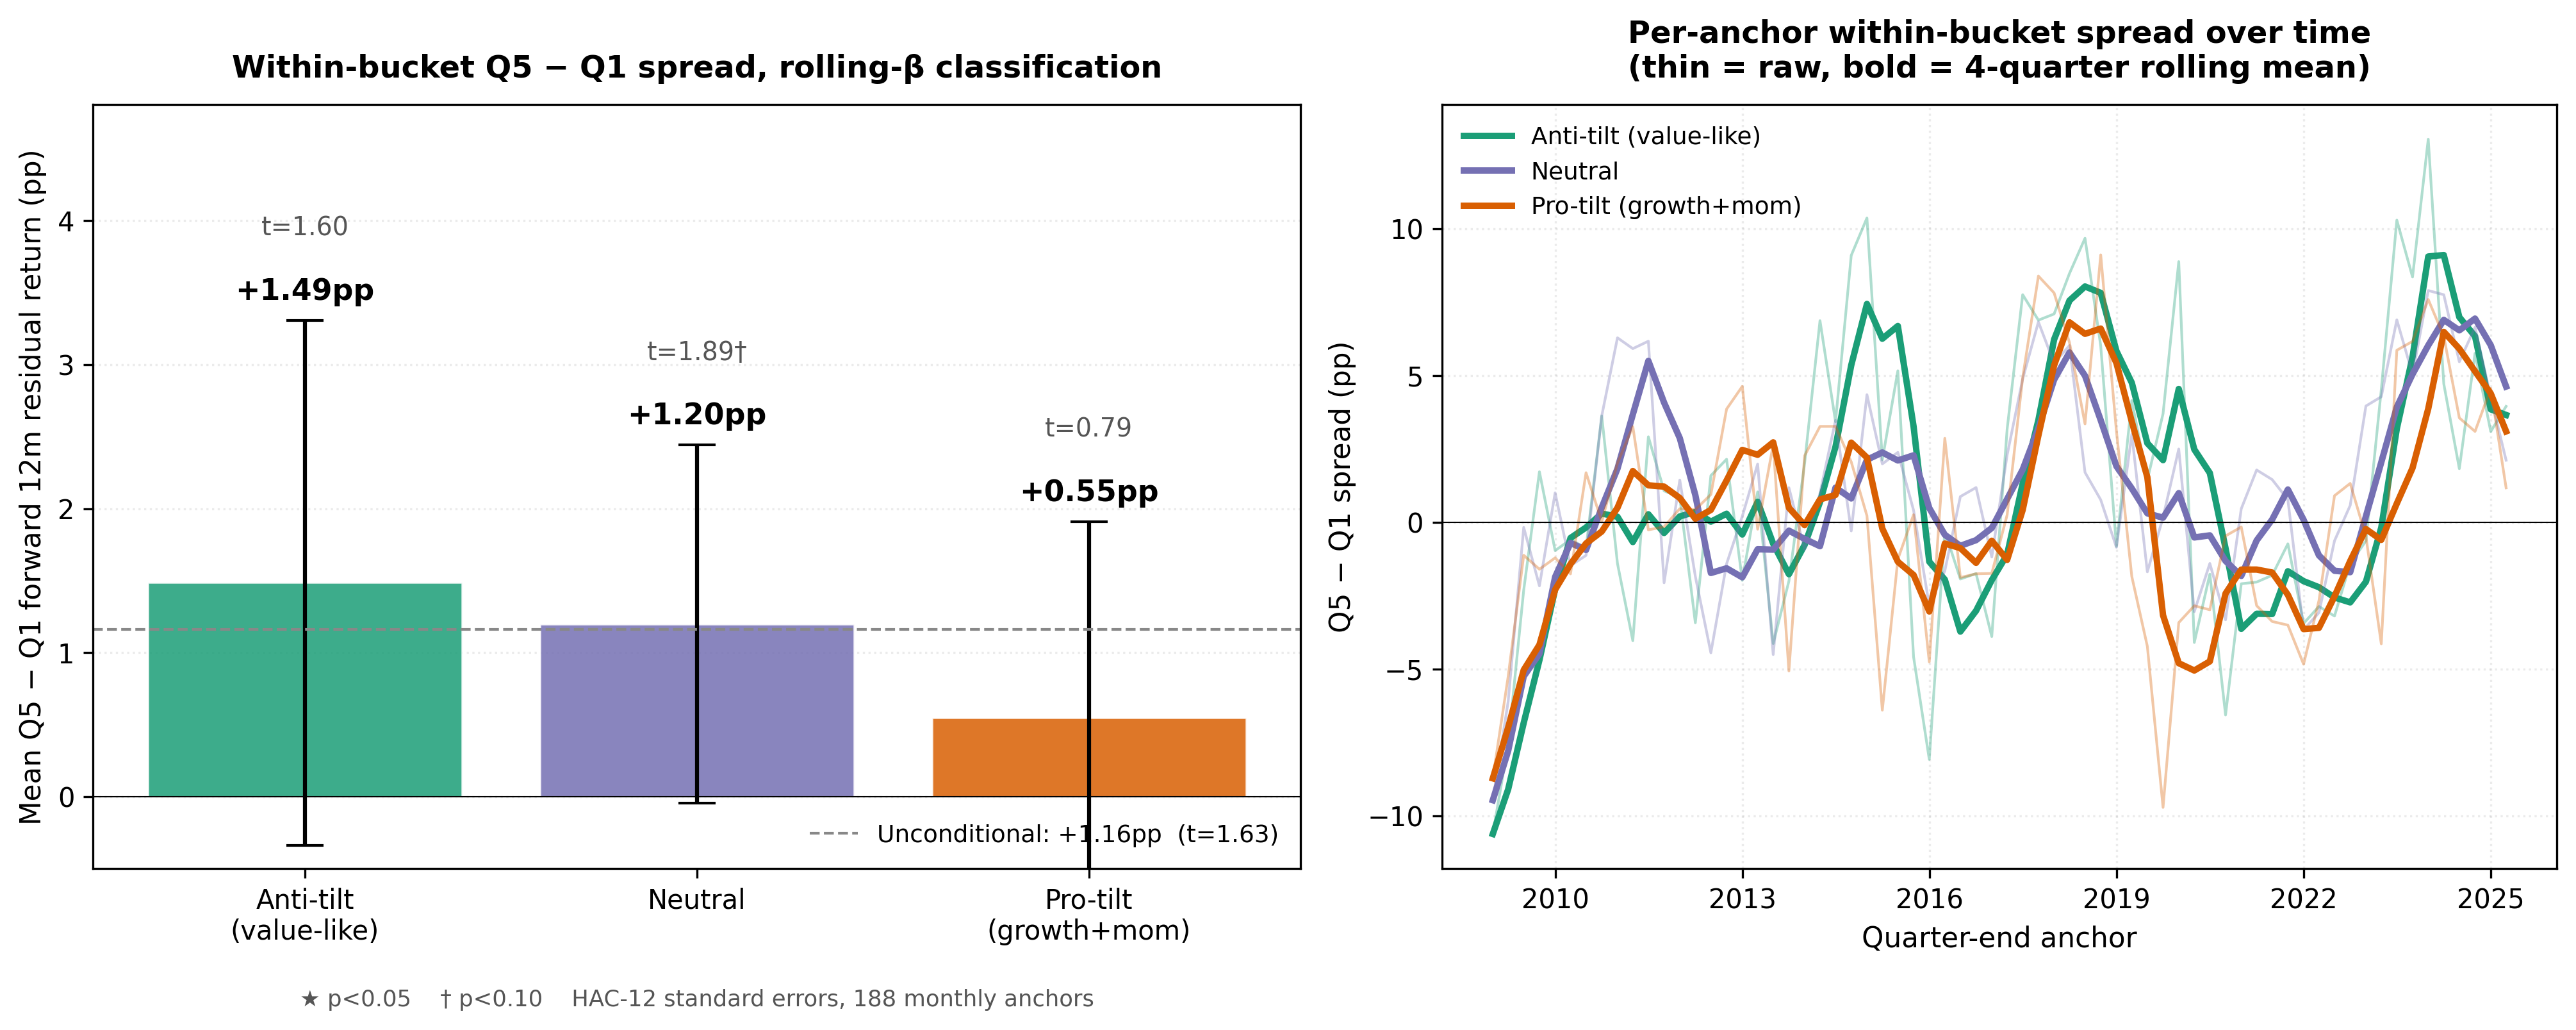
Figure 6 — Within-mandate manager efficiency. Left: mean Q5 − Q1 forward 12-month residual return within each ex-ante style bucket, 95% HAC-12 CIs; dashed line is the unconditional pooled spread. Right: per-anchor within-bucket spreads with 4-quarter rolling means.
| Style bucket | Mean Q5 − Q1 | t-stat (HAC-12) | p | % positive |
|---|---|---|---|---|
| Anti-tilt (value-like residuals) | +2.25pp | 3.23 | 0.001 | 69% |
| Neutral | +0.92pp | 1.68 | 0.09 | 61% |
| Pro-tilt (growth + momentum residuals) | +1.25pp | 2.23 | 0.03 | 63% |
Residual return reflects the manager's realized stock-specific contribution net of fees, implementation costs, cash effects, and trading frictions. It should be read as persistent residual efficiency inside the mandate, not as a pure measure of latent skill.
This is the paper's main result. As the test moves closer to the allocator's mandate-specific decision, the residual signal remains positive and becomes strongest where factor premium is least likely to explain it. ERM3 residual ranking is statistically strong in the anti-tilt and pro-tilt buckets and directionally positive in the neutral bucket (p = 0.09). A factor regression confirms that part of the unconditional spread reflects growth/momentum versus value exposure; that is why the within-mandate result is the cleaner allocator claim (details in Appendix A.4). For mandate filling, the within-bucket figures are the operative numbers.
4.4 Validation summary
Taken together, the validation tests form a ladder from broad evidence to the allocator's actual decision: ranking managers against comparable peers inside a mandate.
| Step | Test | Main takeaway |
|---|---|---|
| 1 | Coverage-qualified monthly sort | Forward information in residual efficiency across the full panel. |
| 2 | Quarter-end cross-section | Recurs through time; not a quarter-by-quarter timing rule. |
| 3 | Style-stripped payoff | Not only a value/growth or momentum payoff. |
| 4 | Within-mandate peer ranking | Ranking persists among managers with similar ex-ante style peers. |
| Step | Test | Forward spread | Reliability |
|---|---|---|---|
| 1 | Coverage-qualified monthly sort | +1.77pp | t = 2.06 |
| 2 | Quarter-end cross-section | +1.48pp mean | 47 / 66 positive |
| 3 | Style-stripped payoff | +1.35pp mean | 43 / 62 positive |
| 4 | Within-mandate: value-like | +2.25pp | t = 3.23 |
| 4 | Within-mandate: neutral | +0.92pp | t = 1.68 |
| 4 | Within-mandate: growth / momentum | +1.25pp | t = 2.23 |
The first three tests establish that residual efficiency contains forward information, appears repeatedly through time, and is not simply a value/growth payoff. The fourth test is the clean allocator claim. Inside ex-ante style buckets, managers are compared only against similar peers, and the residual-efficiency ranking remains positive in every bucket.
5. Caveats and limitations
We list these so allocators can calibrate where the framework is load-bearing.
-
Survivorship. The cohort is the top-1000 active U.S. mutual funds by 2026 AUM. Funds that liquidated, merged, or fell below the cutoff are absent. Bottom-quintile death rates suggest the unconditional spread may be understated relative to a full point-in-time universe.
This sample is intentionally practitioner-oriented rather than a pure academic point-in-time universe. It asks how today's large, investable active mutual funds behaved historically under the ERM3 residual framework. That is relevant for current allocator underwriting, but it conditions on survival and scale. A fully point-in-time reconstruction would include funds that later liquidated, merged, or shrank materially; because those exits are likely concentrated in weaker residual-efficiency cohorts, their inclusion would probably widen, not narrow, the reported Q5–Q1 residual spread.
-
Coverage gating. We require mean ERM3 weight coverage ≥ 85%, dropping roughly 1% of fund-months. International and specialty mandates often fall below this threshold.
-
Benchmark proxy. Independence uses monthly R² on declared benchmark ETF returns; production will move to direct L3 active share and residual active share once per-holding subsector attribution is materialized (§6).
-
Overlapping forward windows and fund clustering. Monthly anchors share 11 of 12 forward months; funds are correlated cross-sectionally. Block bootstrap with fund-cluster correction yields the reported confidence intervals (Appendix A.2).
-
Time-varying benchmark composition. Benchmark-fit R² uses ETF compositions from SEC filings where available; pre-2019 composition gaps remain (Appendix A.5).
-
Panel expansion around 2021. Coverage-gated cohort size jumps from 621 funds (2020-Q4) to 938 (2021-Q2) as ERM3 fund coverage widened. Per-anchor sorts remain internally consistent; cross-anchor variance partly reflects denominator change, not look-ahead bias.
6. Product roadmap
The framework's commercial application is institutional manager-underwriting analytics for asset allocators. Planned extensions:
- Direct L3 active share and residual active share — replace the R² proxy with holdings-based benchmark deviation at subsector depth.
- Per-stock residual contribution attribution — which positions drive the residual layer; event-window stories around earnings or rotation days.
- Daily ETF benchmark returns — cleaner R², event-window fund-vs-benchmark analytics.
- Peer-cohort benchmarks — compare a fund to its institutional peer group's residual distribution, not only a declared ETF.
- L4 style-factor panel (Mkt-RF, SMB, HML, UMD) — define residual net of style exposure so within-mandate residual conditioning is built into the cascade.
This version (Q1 2026 N-PORT BIT, 2026-06-02) uses 997 funds through 2026-05-31; Figure 1 remains anchored at 2025-12-31 until benchmark ETF return series are extended to newer anchors on the production refresh path.
The product value is not a single ranking number. It is a manager-underwriting workflow: decompose the fund, separate style from stock selection, place the manager in peer/style context, and test whether residual efficiency persists.
Appendix A. Methodological detail
A.1 Sample construction
Universe: top-1000 actively managed U.S. mutual funds by 2026 AUM. Coverage
gate: mean_weight_coverage_36m >= 0.85 (ERM3 maps at least 85% of fund AUM).
170,710 fund-month observations, 997 funds, 2007–May 2026. Large-blend body
sample (Figure 1): N=336 at 2025-12-31 anchor (complete scatter coordinates).
Forward-validation panel:
150,355 coverage-gated fund-month rows for bootstrap and quintile sorts.
A.2 Block bootstrap design
Headline Q5 − Q1 spreads are pooled cross-sectional differences across monthly anchors. The 95% confidence interval resamples 12-month blocks of anchors with fund-cluster correction — a related but distinct estimand from the point estimate. The bootstrap CI is therefore not mechanically centered on +1.77pp. Cluster-robust t-statistics (2.06 for trailing residual Sharpe) incorporate overlapping forward windows and cross-sectional fund dependence.
A.3 Figure 4 — full quarterly metrics
| Metric | Quarter-end anchors, 2008-Q4 to 2025-Q1 |
|---|---|
| Anchors covered | 66 |
| Anchors with positive Q5 − Q1 spread | 47 of 66 (71%) |
| Mean per-anchor spread | +1.48pp |
| Median per-anchor spread | +1.28pp |
| Anchors > +1pp | 54.5% |
| Anchors > +2pp | 37.9% |
| Min / Max | −6.99pp (2020-Q3) / +9.97pp (2024-Q1) |
| Cross-sectional σ | 3.24pp |
Strong positive years include 2019 (mean +7.22pp, 4/4 positive) and 2023–2024 (mean +5.82pp, 8/8 positive).
A.3b Figure 5 — style-stripped quarterly cross-section
Method (large-blend cohort, high/medium coverage): At each month anchor, estimate rolling 36-month β to trailing 12-month cumulative Mkt-RF / SMB / HML / UMD on the fund's own residual_return_12m series. Cross-sectionally at that anchor, regress forward 12-month residual return on z(β_HML) and z(β_UMD); use the regression residuals as the payoff. Quintile-sort on trailing residual_sharpe_36m and take Q5 − Q1. Quarter-end anchors only (62 usable quarter-ends in this cohort vs 66 in the full-coverage Figure 4 series).
| Metric | Style-stripped payoff | Same cohort, raw forward residual |
|---|---|---|
| Mean per-anchor spread | +1.35pp | +1.39pp |
| Quarter-ends positive | 43 / 62 (69%) | 40 / 62 (65%) |
Reproduce: research/exhibit5c_style_adjusted_quarterly.py (Ken French factor
CSVs under /tmp/ff_factors/).
A.4 Carhart decomposition of the unconditional spread
A Carhart 4-factor regression of pooled Q5 − Q1 forward 12-month residual return on contemporaneous factor returns (HAC-12 errors, n = 197 monthly anchors):
| Factor | β | t-stat |
|---|---|---|
| HML | −13.6 | −6.1 |
| UMD | +10.3 | +4.4 |
| Factor-residual α | +0.21pp | 0.59 |
The Q5 portfolio loads growth-momentum relative to Q1; part of the unconditional spread reflects style premium. The within-mandate buckets in §4.3 isolate manager efficiency conditional on ex-ante tilt.
The current within-mandate buckets use a rolling residual-return factor classification, z(β_UMD) − z(β_HML), because it is observable at each anchor and avoids using future holdings or later benchmark labels. Future work could compare this rolling residual-based classification with simpler alternatives, including β_HML-only terciles and declared benchmark/style-map cohorts.
A.5 Benchmark ETF composition
Benchmark-fit R² uses each ETF's time-varying composition from SEC N-PORT
filings where available, with flat-hold assumptions between filing dates.
Pre-2019 benchmark composition gaps will be closed via N-Q backfill. Daily
ETF returns (ds_fund_returns_daily.zarr for benchmark ETFs) will replace
monthly R² for finer variance attribution.
A.6 Residual vs gross forward prediction
Supplementary analysis (Figure A, available on request) shows trailing residual Sharpe does not predict forward gross return — only forward residual return. Predictive validation is specific to the stock-specific layer ERM3 isolates.
A.7 Data currency (this version)
Q1 2026 N-PORT BIT: 2026-06-02. Refreshed manager-profile dataset and block-bootstrap CI (point +1.77pp, 95% CI [+0.29, +2.96], t = 2.06 on the coverage-gated panel). Next quarterly refresh (Q2 2026 BIT, 2026-09-02) expected to extend Figure 1 anchor to 2026-03-31.
A.8 RiskModels API access (summary)
The figures and headline statistics in this paper were produced on Blue
Water's internal research stack (frozen manager_profile panel and exhibit
scripts). The public surface for the same ERM3 fund decomposition is the
RiskModels API at https://riskmodels.app (OpenAPI and quickstart:
https://riskmodels.app/quickstart).
What allocators can pull today: per-fund monthly cascade history including
portfolio_idiosyncratic_return (the residual layer in §2), composed
fund snapshots, style cohorts such as large-blend, and peer rankings on
residual metrics. Use weight_sum on each portfolio row to approximate
the paper's coverage gate (trailing 36-month mean ≥ 85% of AUM mapped into
the ERM3 universe).
What still requires the research panel: block-bootstrap confidence
intervals, Figure 4/5 quarterly tables, Carhart decomposition, and §4.3
within-mandate bucket statistics. Those are batch outputs on the frozen
manager_profile artifact until a cohort-export API ships.
Developers: install riskmodels-py, set RISKMODELS_API_KEY from
https://riskmodels.app/get-key, and call GET /api/funds/{bw_fund_id}/portfolio
for residual history. A full route map, SDK examples, and reproduction
notes live in the companion file
research/papers/beyond-active-share/appendix-a8-api-replication.md (not
included in this PDF).
Data sources: ERM3 multi-layer cascade (proprietary); SEC EDGAR Form N-1A filings (declared benchmarks); SEC EDGAR Form N-PORT / N-Q holdings (2004-2026); EODHD daily security prices; iShares sponsor data (ETF benchmark holdings).
Contact: conrad@bwmacro.com · RiskModels Research · BlueWater Macro.