Skip to content
HomePrimerWorkspaceResearchReferencesAboutSign in
riskmodels.appSign in

Workspace

The Analyst Workspace

Everything on riskmodels.org is the method. The Analyst Workspace is where you run it. Bring a portfolio and riskmodels.net returns the same market, sector, subsector, and residual decomposition the research is built on — measured on your own holdings, at a single address, with nothing to install.

Open the Analyst WorkspaceRead the primer
The riskmodels.net Analyst Workspace — a portfolio decomposition table with an agent panel alongside.
riskmodels.net — you arrive directly in the Analyst Workspace. The decomposition sits center; the agent sits alongside.

How to find it

  1. 01

    Go to riskmodels.net

    There is no separate dashboard and no setup step. The home page is the workspace — you land directly in the Analyst Workspace.

  2. 02

    Bring a portfolio

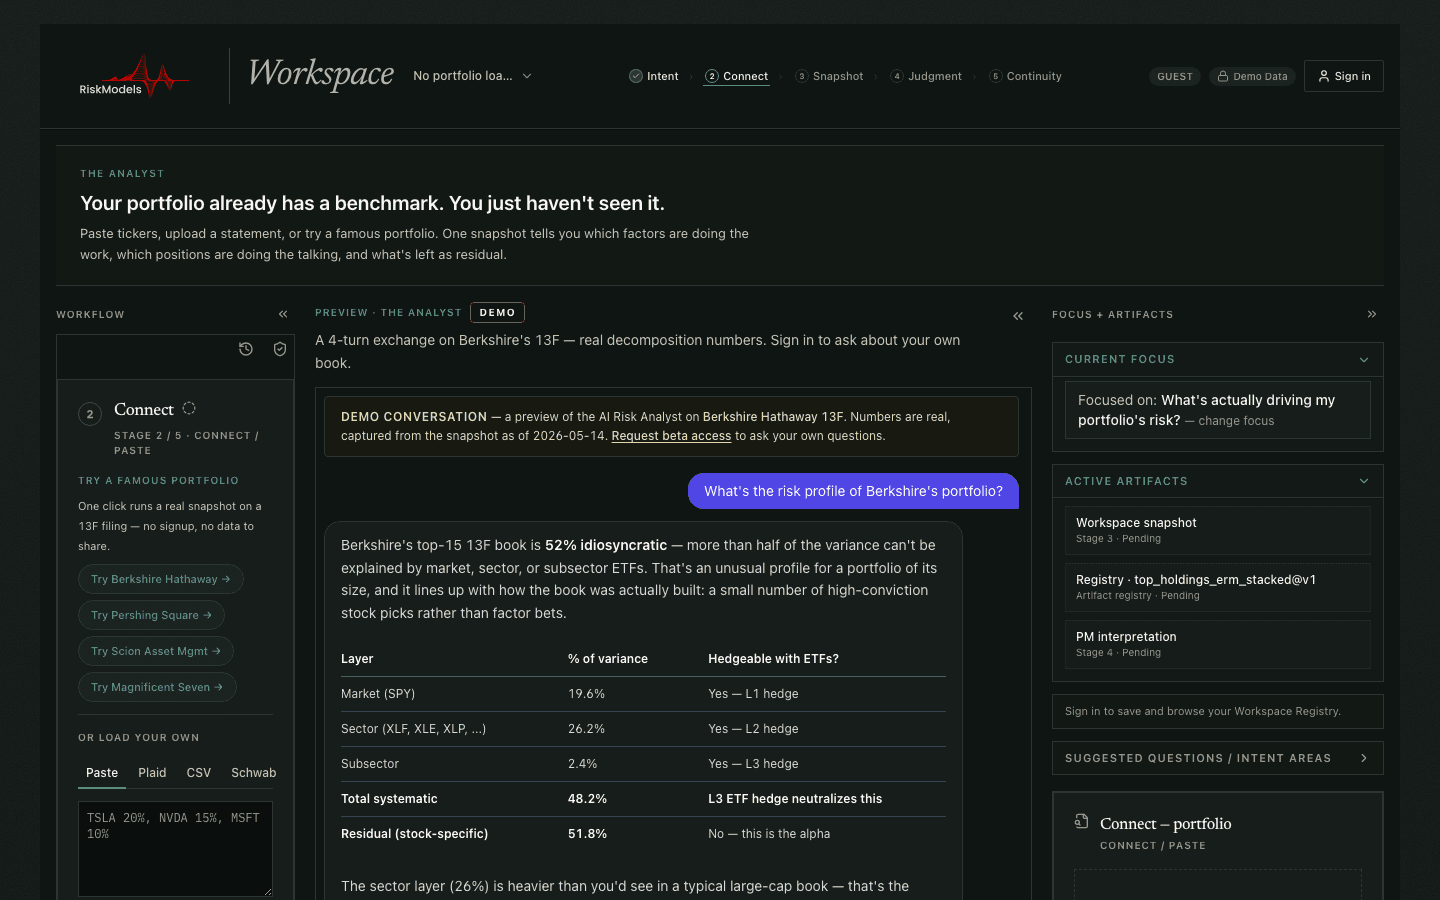
    Describe your holdings to the agent in plain language, or import a position list. A live Berkshire Hathaway book is loaded by default, so you can read the full output before committing anything of your own.

  3. 03

    Read the decomposition

    The workspace separates every position — and the book as a whole — into market, sector, subsector, and residual variance, then rolls those layers into the benchmark your portfolio actually trades against.

Early beta. Anyone can open the workspace and explore the demo. Running it on your own holdings is invite-managed while the product matures — request access from inside the workspace and we will be in touch.

See the idea move

The decomposition, in two terms

Before you open the workspace, here is the core idea. Total variance splits into a systematic part, β²σ_m², and a residual part, σ_ε². The workspace resolves that residual further into sector and subsector layers; the control below holds it to two so the mechanics stay visible. Units are normalized and illustrative — move the sliders and watch a low headline beta still carry a large residual.

Systematic vs. idiosyncratic variance
An illustrative two-term model. The sliders isolate β²σ_m² (systematic) from σ_ε² (residual) in normalized units — move them to see how a low headline beta can still sit on a large residual.

Beyond the demo: the Analyst Workspace at riskmodels.net runs the full N-factor decomposition — market, sector, subsector, and residual — on real holdings across 45,000+ global tickers.

0.70
60%
72
Systematic share
26.7%
Idiosyncratic share
73.3%
Illustrative total variance (a.u.)
183.3

Stacked variance decomposition (normalized units).

Distribute research

Share to LinkedIn
Open the Analyst WorkspaceRead the references

Subscribe to the Quarterly Attribution Review.

Built around the SEC disclosure cycle — see the SEC Filing Calendar for upcoming 13F / 10-K / N-PORT deadlines.

By registering, you agree to receive technical factor research and API deployment logs. RM-Registry-2026. Privacy Policy.

RiskModels.org

A research surface for hierarchical orthogonal decomposition, variance attribution, and allocator-grade risk measurement. Operational APIs and developer workflows live at riskmodels.app.

Subscribe to the Quarterly Attribution Review.

Built around the SEC disclosure cycle — see the SEC Filing Calendar for upcoming 13F / 10-K / N-PORT deadlines.

By registering, you agree to receive technical factor research and API deployment logs. RM-Registry-2026. Privacy Policy.

Sign inHomePrimerWorkspaceResearchReferencesAboutMethodology noteOne-pagerAPI docsWeb appContactStatus
RiskModelsResearch/Workspace/API